Figuring Out Depthcrawl Math
When running a depthcrawl you procedurally generate locations on the map by rolling dX+Depth, where Depth is the distance in points from the start of the crawl, on Locations and Details tables and then combine the results. Each result on the two tables are not equally likely to appear during a given crawl because the Depth value creates a sliding window of X results for each roll.
Examining The Gardens of Ynn and The Stygian Library
Lets take a closer look at The Gardens of Ynn and The Stygian Library. Each provide Locations and Details tables each with 34 possible results. When you combine the results from the two tables to get 1156 unique combinations. You roll a d20+Depth for each table to generate the location+detail combination. Both are open-ended depthcrawls so the party can go as deep as they want as long as their resources last. This means it’s possible to get a result greater than 24. To account for this each table adds a 35+ result where you re-roll d20+d12+2.
Below is the percent chance of each result appearing when performing simulations1 for depths of 5, 10, 15, 20, 25, and 30. The simulations account for the impact of the overflow re-roll and assumes the party just plows straight ahead with no branching to keep the math simple. When reading the table X/Y% means the result will most likely appear at least X times with Y percent chance of an additional appearance.
The Gardens of Ynn and The Stygian Library by Depth
If we look at the table below there’s a clear curve to the probabilities. This makes sense since we’re basically rolling two dice; 1 of them just happens to give sequential results. The other thing to notice is the impact of the re-roll when the result overflows the table. The peak of the curve keeps shifting further down the results table the deeper the crawl goes.
Because this is a persistent island depthcrawl we know that the value of the depth is capped. I think something in between D10 and D15 gives us a good spread of result options. We want to balance the variety with predictability. I’m going to go with D12 because I like the number 12. Having a hard depth along with tweaking the size of the window (we’ll look at that next) we will hopefully dial in the right balance.
| Result | D5 | D10 | D15 | D20 | D25 | D30 |
|---|---|---|---|---|---|---|
| 1 | 5% | 5% | 5% | 5% | 5% | 5% |
| 2 | 10% | 10% | 10% | 10% | 10% | 10% |
| 3 | 15% | 15% | 15% | 15% | 15% | 15% |
| 4 | 20% | 20% | 20% | 20% | 21% | 23% |
| 5 | 25% | 25% | 25% | 26% | 28% | 31% |
| 6 | 30% | 30% | 30% | 31% | 34% | 39% |
| 7 | 30% | 35% | 35% | 37% | 41% | 46% |
| 8 | 30% | 40% | 40% | 42% | 47% | 54% |
| 9 | 30% | 45% | 45% | 48% | 53% | 62% |
| 10 | 30% | 50% | 50% | 53% | 60% | 70% |
| 11 | 30% | 55% | 55% | 59% | 66% | 78% |
| 12 | 30% | 55% | 60% | 64% | 72% | 85% |
| 13 | 30% | 55% | 65% | 70% | 79% | 94% |
| 14 | 30% | 55% | 70% | 75% | 85% | 1/1% |
| 15 | 30% | 55% | 75% | 80% | 92% | 1/9% |
| 16 | 30% | 55% | 80% | 85% | 97% | 1/14% |
| 17 | 30% | 55% | 80% | 90% | 1/2% | 1/19% |
| 18 | 30% | 55% | 80% | 95% | 1/7% | 1/24% |
| 19 | 30% | 55% | 80% | 1/0% | 1/12% | 1/29% |
| 20 | 30% | 55% | 80% | 1/5% | 1/17% | 1/34% |
| 21 | 25% | 50% | 75% | 1/5% | 1/16% | 1/34% |
| 22 | 20% | 45% | 70% | 1/0% | 1/16% | 1/34% |
| 23 | 15% | 40% | 65% | 95% | 1/16% | 1/34% |
| 24 | 10% | 35% | 60% | 90% | 1/15% | 1/31% |
| 25 | 5% | 30% | 55% | 84% | 1/14% | 1/28% |
| 26 | 0% | 25% | 50% | 79% | 1/12% | 1/25% |
| 27 | 0% | 20% | 45% | 73% | 1/6% | 1/23% |
| 28 | 0% | 15% | 40% | 68% | 1/0% | 1/20% |
| 29 | 0% | 10% | 35% | 63% | 93% | 1/17% |
| 30 | 0% | 5% | 30% | 57% | 87% | 1/14% |
| 31 | 0% | 0% | 25% | 52% | 80% | 1/11% |
| 32 | 0% | 0% | 20% | 46% | 74% | 1/4% |
| 33 | 0% | 0% | 15% | 41% | 68% | 96% |
| 34 | 0% | 0% | 10% | 35% | 61% | 88% |
The Gardens of Ynn and The Stygian Library by Die (Depth 20)
Pulling the other lever, we want to control the size of the window of results as governed by the die rolled. The table below shows the probabilities we see when going to Depth 20 with 34 results when using different sized dice. Like before bigger numbers mean steeper curves and the more potential results.
Since we flattened the curve by choose D12 before, I don’t think we want the flatness of a d4. For the same reason as a large depth reduced predictability too much a d20 feels too big. I feel like a d10 or a d12 would give me the curve I want and we already know about how I feel about the number 12. So lets go with a d12.
| Result | d4 | d6 | d8 | d10 | d12 | d20 |
|---|---|---|---|---|---|---|
| 1 | 25% | 17% | 12% | 10% | 8% | 5% |
| 2 | 50% | 33% | 25% | 20% | 17% | 10% |
| 3 | 75% | 50% | 38% | 30% | 25% | 15% |
| 4 | 1/0% | 67% | 50% | 40% | 33% | 21% |
| 5 | 1/0% | 83% | 62% | 50% | 42% | 26% |
| 6 | 1/0% | 1/0% | 75% | 60% | 50% | 31% |
| 7 | 1/0% | 1/0% | 88% | 70% | 58% | 37% |
| 8 | 1/0% | 1/0% | 1/0% | 80% | 67% | 42% |
| 9 | 1/0% | 1/0% | 1/0% | 90% | 75% | 48% |
| 10 | 1/0% | 1/0% | 1/0% | 1/0% | 83% | 53% |
| 11 | 1/0% | 1/0% | 1/0% | 1/0% | 92% | 59% |
| 12 | 1/0% | 1/0% | 1/0% | 1/0% | 1/0% | 64% |
| 13 | 1/0% | 1/0% | 1/0% | 1/0% | 1/0% | 69% |
| 14 | 1/0% | 1/0% | 1/0% | 1/0% | 1/0% | 75% |
| 15 | 1/0% | 1/0% | 1/0% | 1/0% | 1/0% | 80% |
| 16 | 1/0% | 1/0% | 1/0% | 1/0% | 1/0% | 85% |
| 17 | 1/0% | 1/0% | 1/0% | 1/0% | 1/0% | 90% |
| 18 | 1/0% | 1/0% | 1/0% | 1/0% | 1/0% | 95% |
| 19 | 1/0% | 1/0% | 1/0% | 1/0% | 1/0% | 1/0% |
| 20 | 1/0% | 1/0% | 1/0% | 1/0% | 1/0% | 1/5% |
| 21 | 1/0% | 1/0% | 1/0% | 1/0% | 1/0% | 1/6% |
| 22 | 75% | 83% | 88% | 90% | 92% | 1/0% |
| 23 | 50% | 67% | 75% | 80% | 83% | 95% |
| 24 | 25% | 50% | 62% | 70% | 75% | 90% |
| 25 | 0% | 33% | 50% | 60% | 66% | 84% |
| 26 | 0% | 17% | 37% | 50% | 58% | 79% |
| 27 | 0% | 0% | 25% | 40% | 50% | 74% |
| 28 | 0% | 0% | 13% | 30% | 42% | 68% |
| 29 | 0% | 0% | 0% | 20% | 33% | 63% |
| 30 | 0% | 0% | 0% | 10% | 25% | 57% |
| 31 | 0% | 0% | 0% | 0% | 17% | 52% |
| 32 | 0% | 0% | 0% | 0% | 8% | 46% |
| 33 | 0% | 0% | 0% | 0% | 0% | 41% |
| 34 | 0% | 0% | 0% | 0% | 0% | 35% |
Planning the Jungle Island
We have now made some decisions we can test. We are going to cap the depth at 12 and the roll to d12 as well. Because the depth is capped, unlike The Gardens of Ynn and The Stygian Library, we don’t need to account for overflows. The maximum potential result is 24. Lets run the same kind of simulation as we did before; no branching.
Depth and Die Constrained Jungle Island Depthcrawl
We get the V shape curve we expect when rolling 2 dice and because the cap for both the depth and the die is identical it peaks at the center. When it comes to authoring values for Locations and Details that predictability of frequency should serve us well.
| Result | Probability | Result | Probability | Result | Probability |
|---|---|---|---|---|---|
| 1 | 8% | 9 | 75% | 17 | 67% |
| 2 | 17% | 10 | 83% | 18 | 59% |
| 3 | 25% | 11 | 92% | 19 | 50% |
| 4 | 33% | 12 | 1/0% | 20 | 41% |
| 5 | 42% | 13 | 1/0% | 21 | 33% |
| 6 | 50% | 14 | 92% | 22 | 25% |
| 7 | 58% | 15 | 83% | 23 | 17% |
| 8 | 67% | 16 | 75% | 24 | 8% |
Depth and Die Constrained Branching Jungle Island Depthcrawl
A persistent island depthcrawl doesn’t just go in a straight line from coast to coast like we’ve been simulating. The party is going to branch as they explore more of the island. If we figure out the constraints of our map we can account for that as well. To that end I threw the map below together. I’m not sure what I’m going to do (if anything) with those small circles on the diagonals, but I threw them in there just in case.
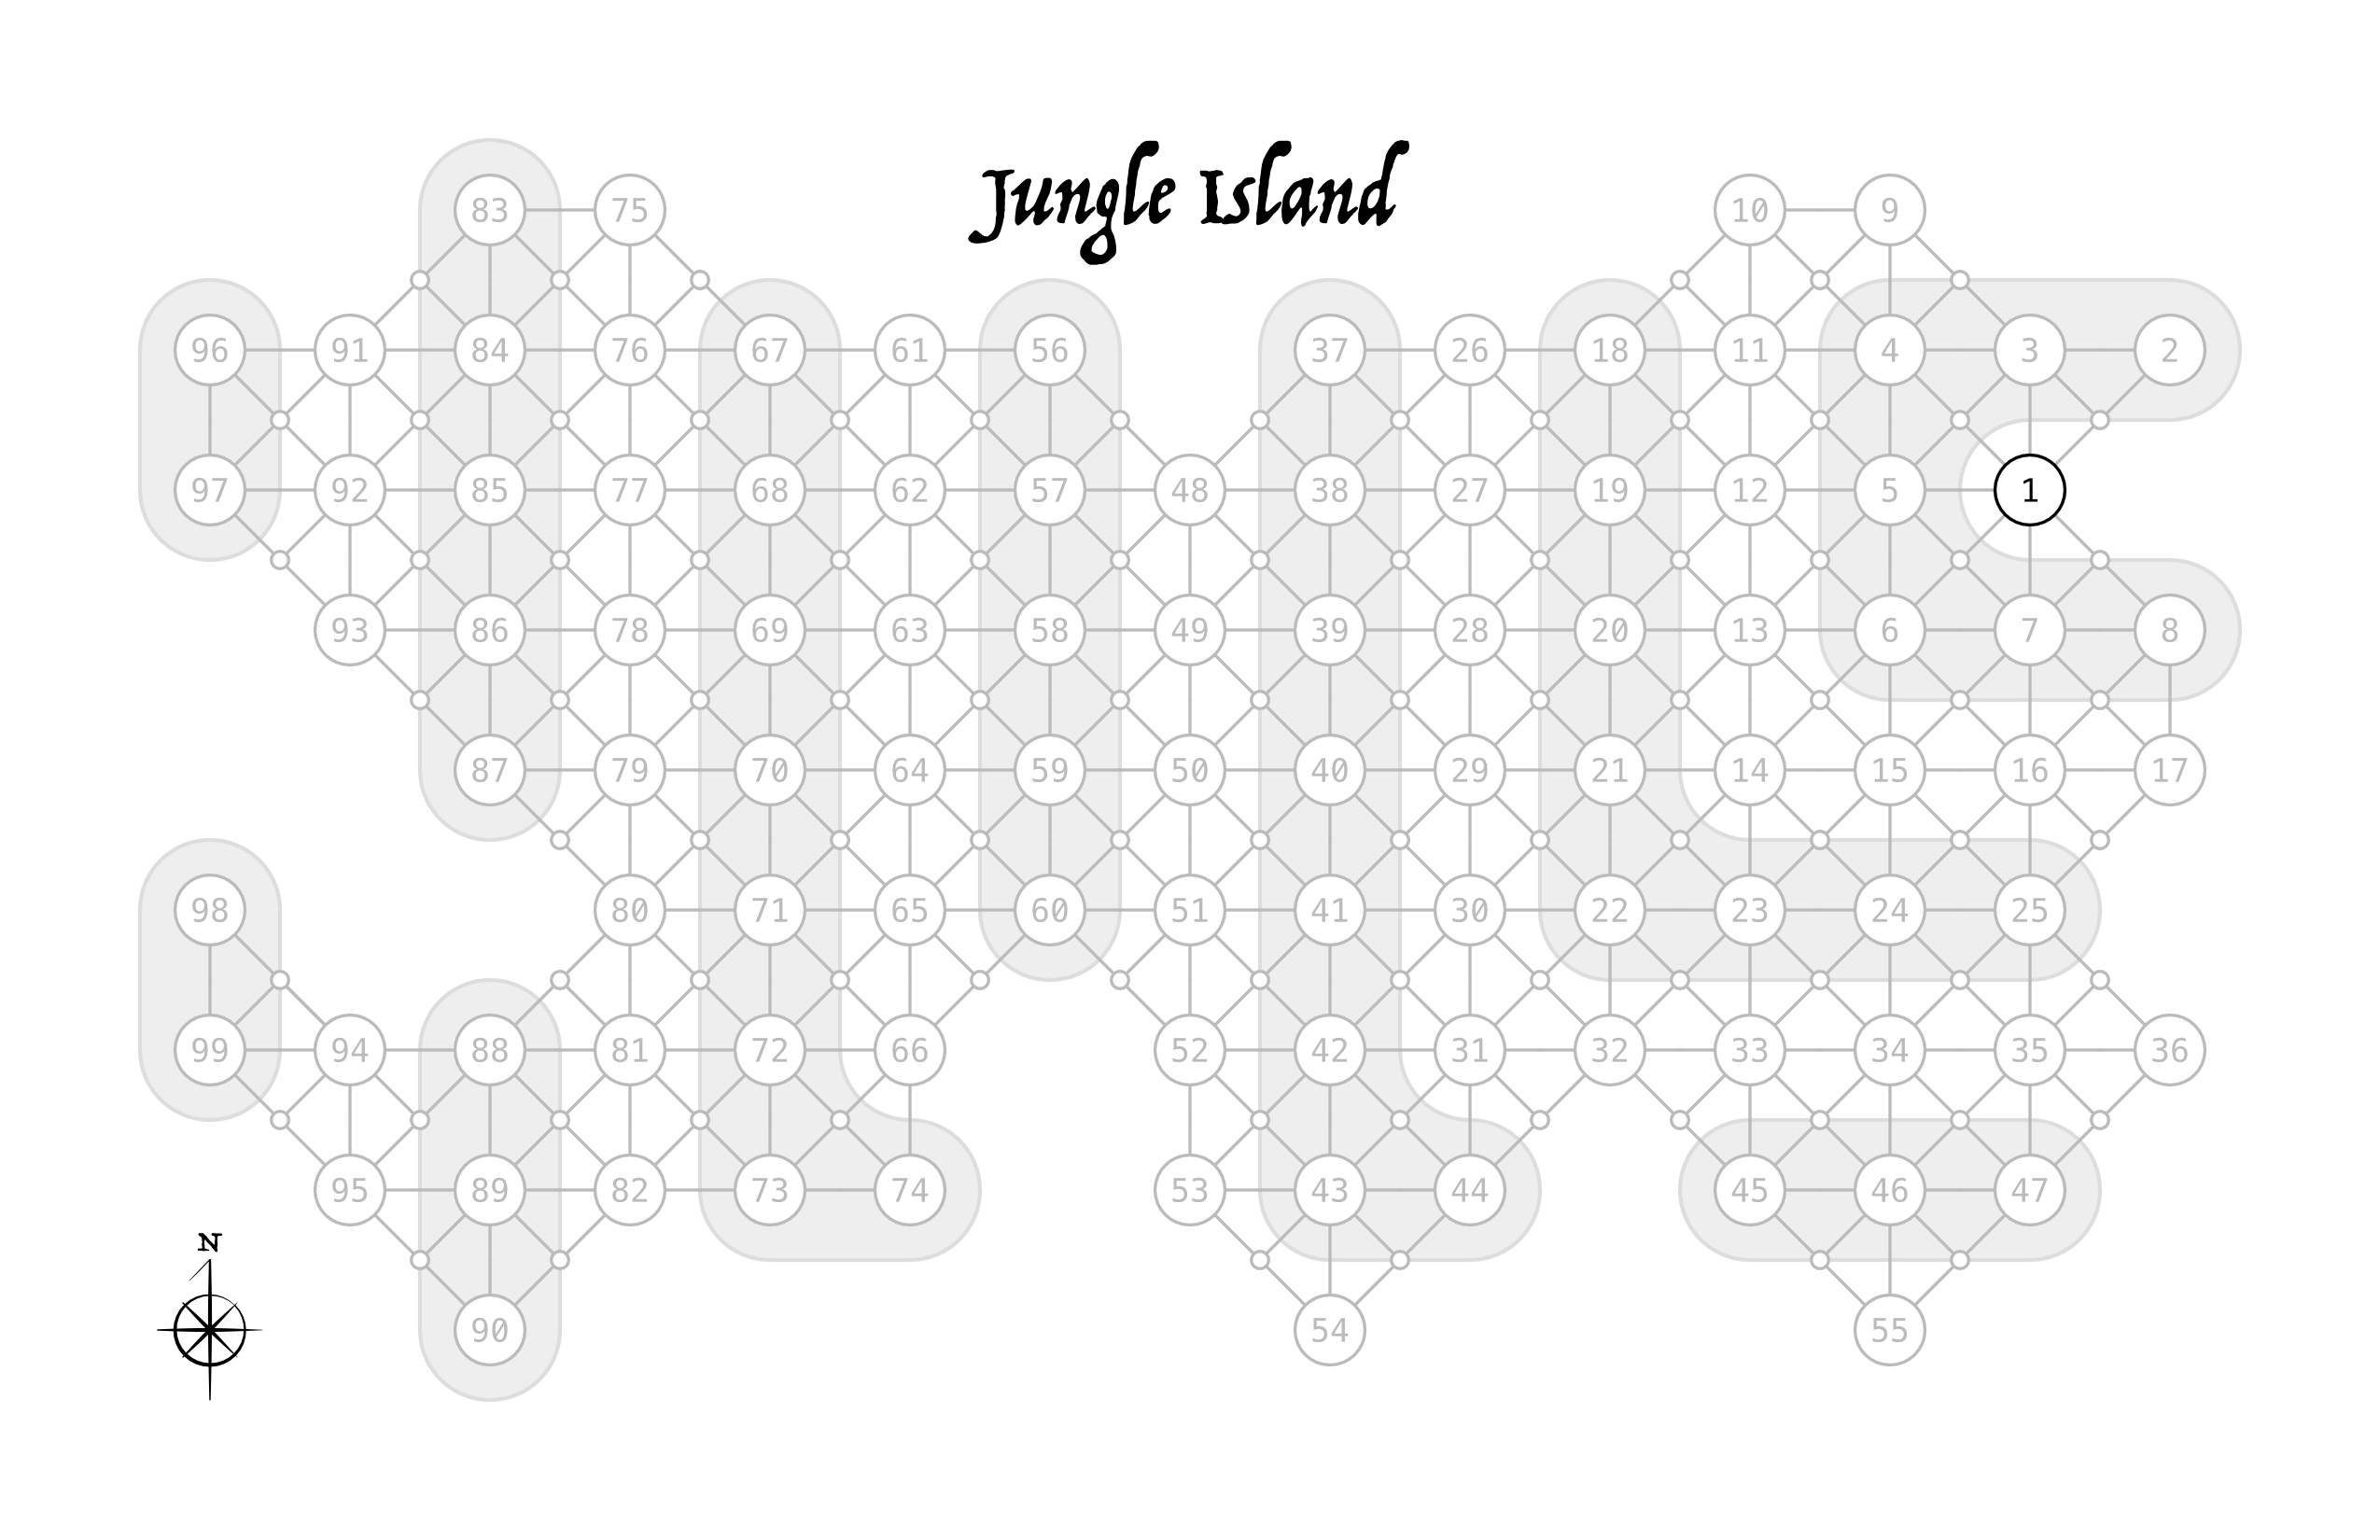
The party will start at point 1 (in black) for every campaign and explore from there. The gray shapes are there to help quickly count depth in the number of points you need to travel to get to any point from point 1. With this map we know exactly how many times each depth will be rolled once the map is fully explored. There are 99 points in 13 depths (0 to 12) where the number of points per depth are 7, 9, 8, 11, 11, 8, 5, 6, 8, 8, 8, 5, and 4 respectively.
The table below doesn’t give me as clean a result as I would like, but without making the island rectangular I don’t know that my ideal is achievable. I feel like overall the balance of predictability and variability is preserved. We can guess pretty roughly how many of each result will appear but where on the island is largely unpredictable. The ends are questionable on if they will show, so we shouldn’t count on them but because of their hit or miss nature they can be quite fantastical without seriously breaking the fantasy.
I think authoring the results would be easier if I give them a frequency groups. There’s no perfect way to make these groupings but I landed on Very Common (5 results), Common (8 results), Uncommon (8 results), and Rare (3 results).
| Result | Probability | Frequency | Result | Probability | Frequency |
|---|---|---|---|---|---|
| 1 | 58% | Rare | 13 | 7/58% | Very Common |
| 2 | 1/33% | Uncommon | 14 | 6/84% | Very Common |
| 3 | 2/0% | Uncommon | 15 | 6/16% | Common |
| 4 | 2/92% | Uncommon | 16 | 5/25% | Common |
| 5 | 3/83% | Common | 17 | 4/34% | Common |
| 6 | 4/49% | Common | 18 | 3/67% | Uncommon |
| 7 | 4/92% | Common | 19 | 3/25% | Uncommon |
| 8 | 5/42% | Common | 20 | 2/75% | Uncommon |
| 9 | 6/9% | Common | 21 | 2/8% | Uncommon |
| 10 | 6/75% | Very Common | 22 | 1/42% | Uncommon |
| 11 | 7/42% | Very Common | 23 | 75% | Rare |
| 12 | 7/83% | Very Common | 24 | 33% | Rare |