Rethinking The Island
Now that I’ve had a night to sleep on it, I don’t like the haphazard distribution of results on the Jungle Island depthcrawl. I think I can create a predictable pattern without making the boundaries of the island feel too artificial.
Where I Started
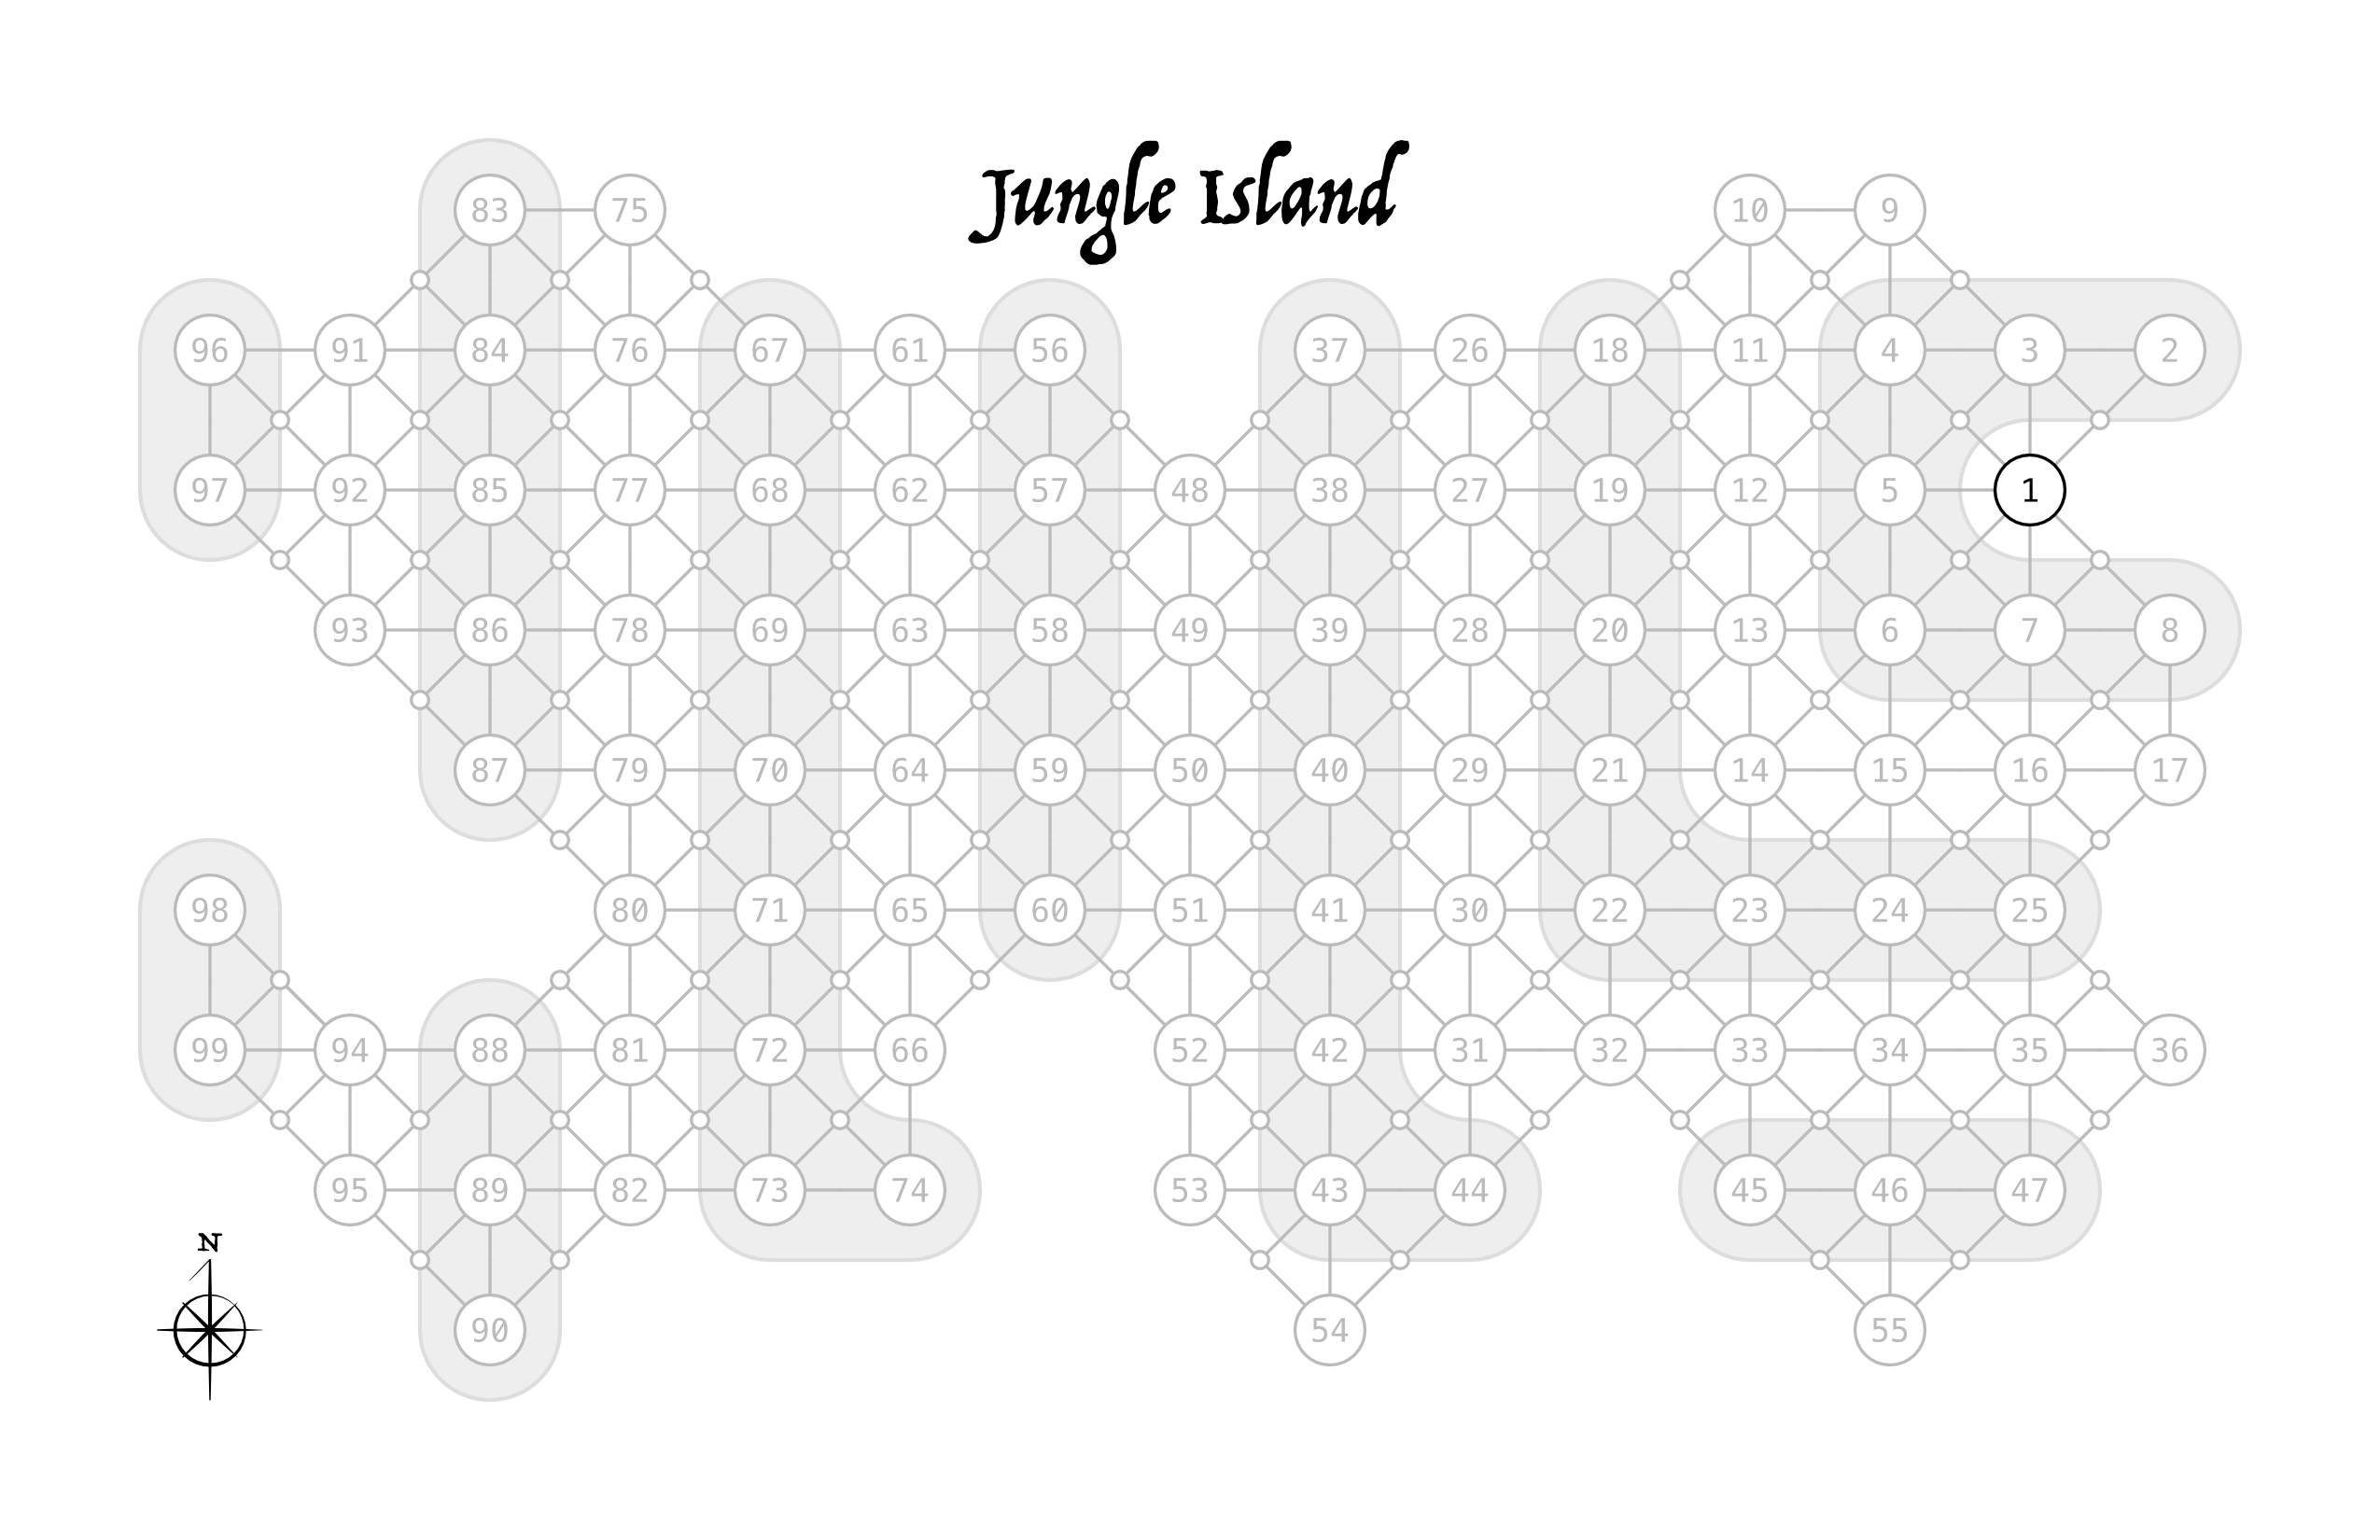
As a reminder I started with the following. The probabilities were calculated by simulating depthcrawls on the island shown using a ruby script1. I feel like overall the balance of predictability and variability is preserved, but I feel hard to write for this and make the frequency of result feel intuitive. I’m particularly concerned for writing future modules that will plug into this table.
I started with this map and then generated the table after it.
| Result | Probability | Frequency | Result | Probability | Frequency |
|---|---|---|---|---|---|
| 1 | 58% | Rare | 13 | 7/58% | Very Common |
| 2 | 1/33% | Uncommon | 14 | 6/84% | Very Common |
| 3 | 2/0% | Uncommon | 15 | 6/16% | Common |
| 4 | 2/92% | Uncommon | 16 | 5/25% | Common |
| 5 | 3/83% | Common | 17 | 4/34% | Common |
| 6 | 4/49% | Common | 18 | 3/67% | Uncommon |
| 7 | 4/92% | Common | 19 | 3/25% | Uncommon |
| 8 | 5/42% | Common | 20 | 2/75% | Uncommon |
| 9 | 6/9% | Common | 21 | 2/8% | Uncommon |
| 10 | 6/75% | Very Common | 22 | 1/42% | Uncommon |
| 11 | 7/42% | Very Common | 23 | 75% | Rare |
| 12 | 7/83% | Very Common | 24 | 33% | Rare |
Lucky for me, that script will come in handy. I can use it to model different shapes of the distribution of points by depth. Once I find a distribution who’s shape I like I can use that as a constraint for creating the island map.
Where I Ended
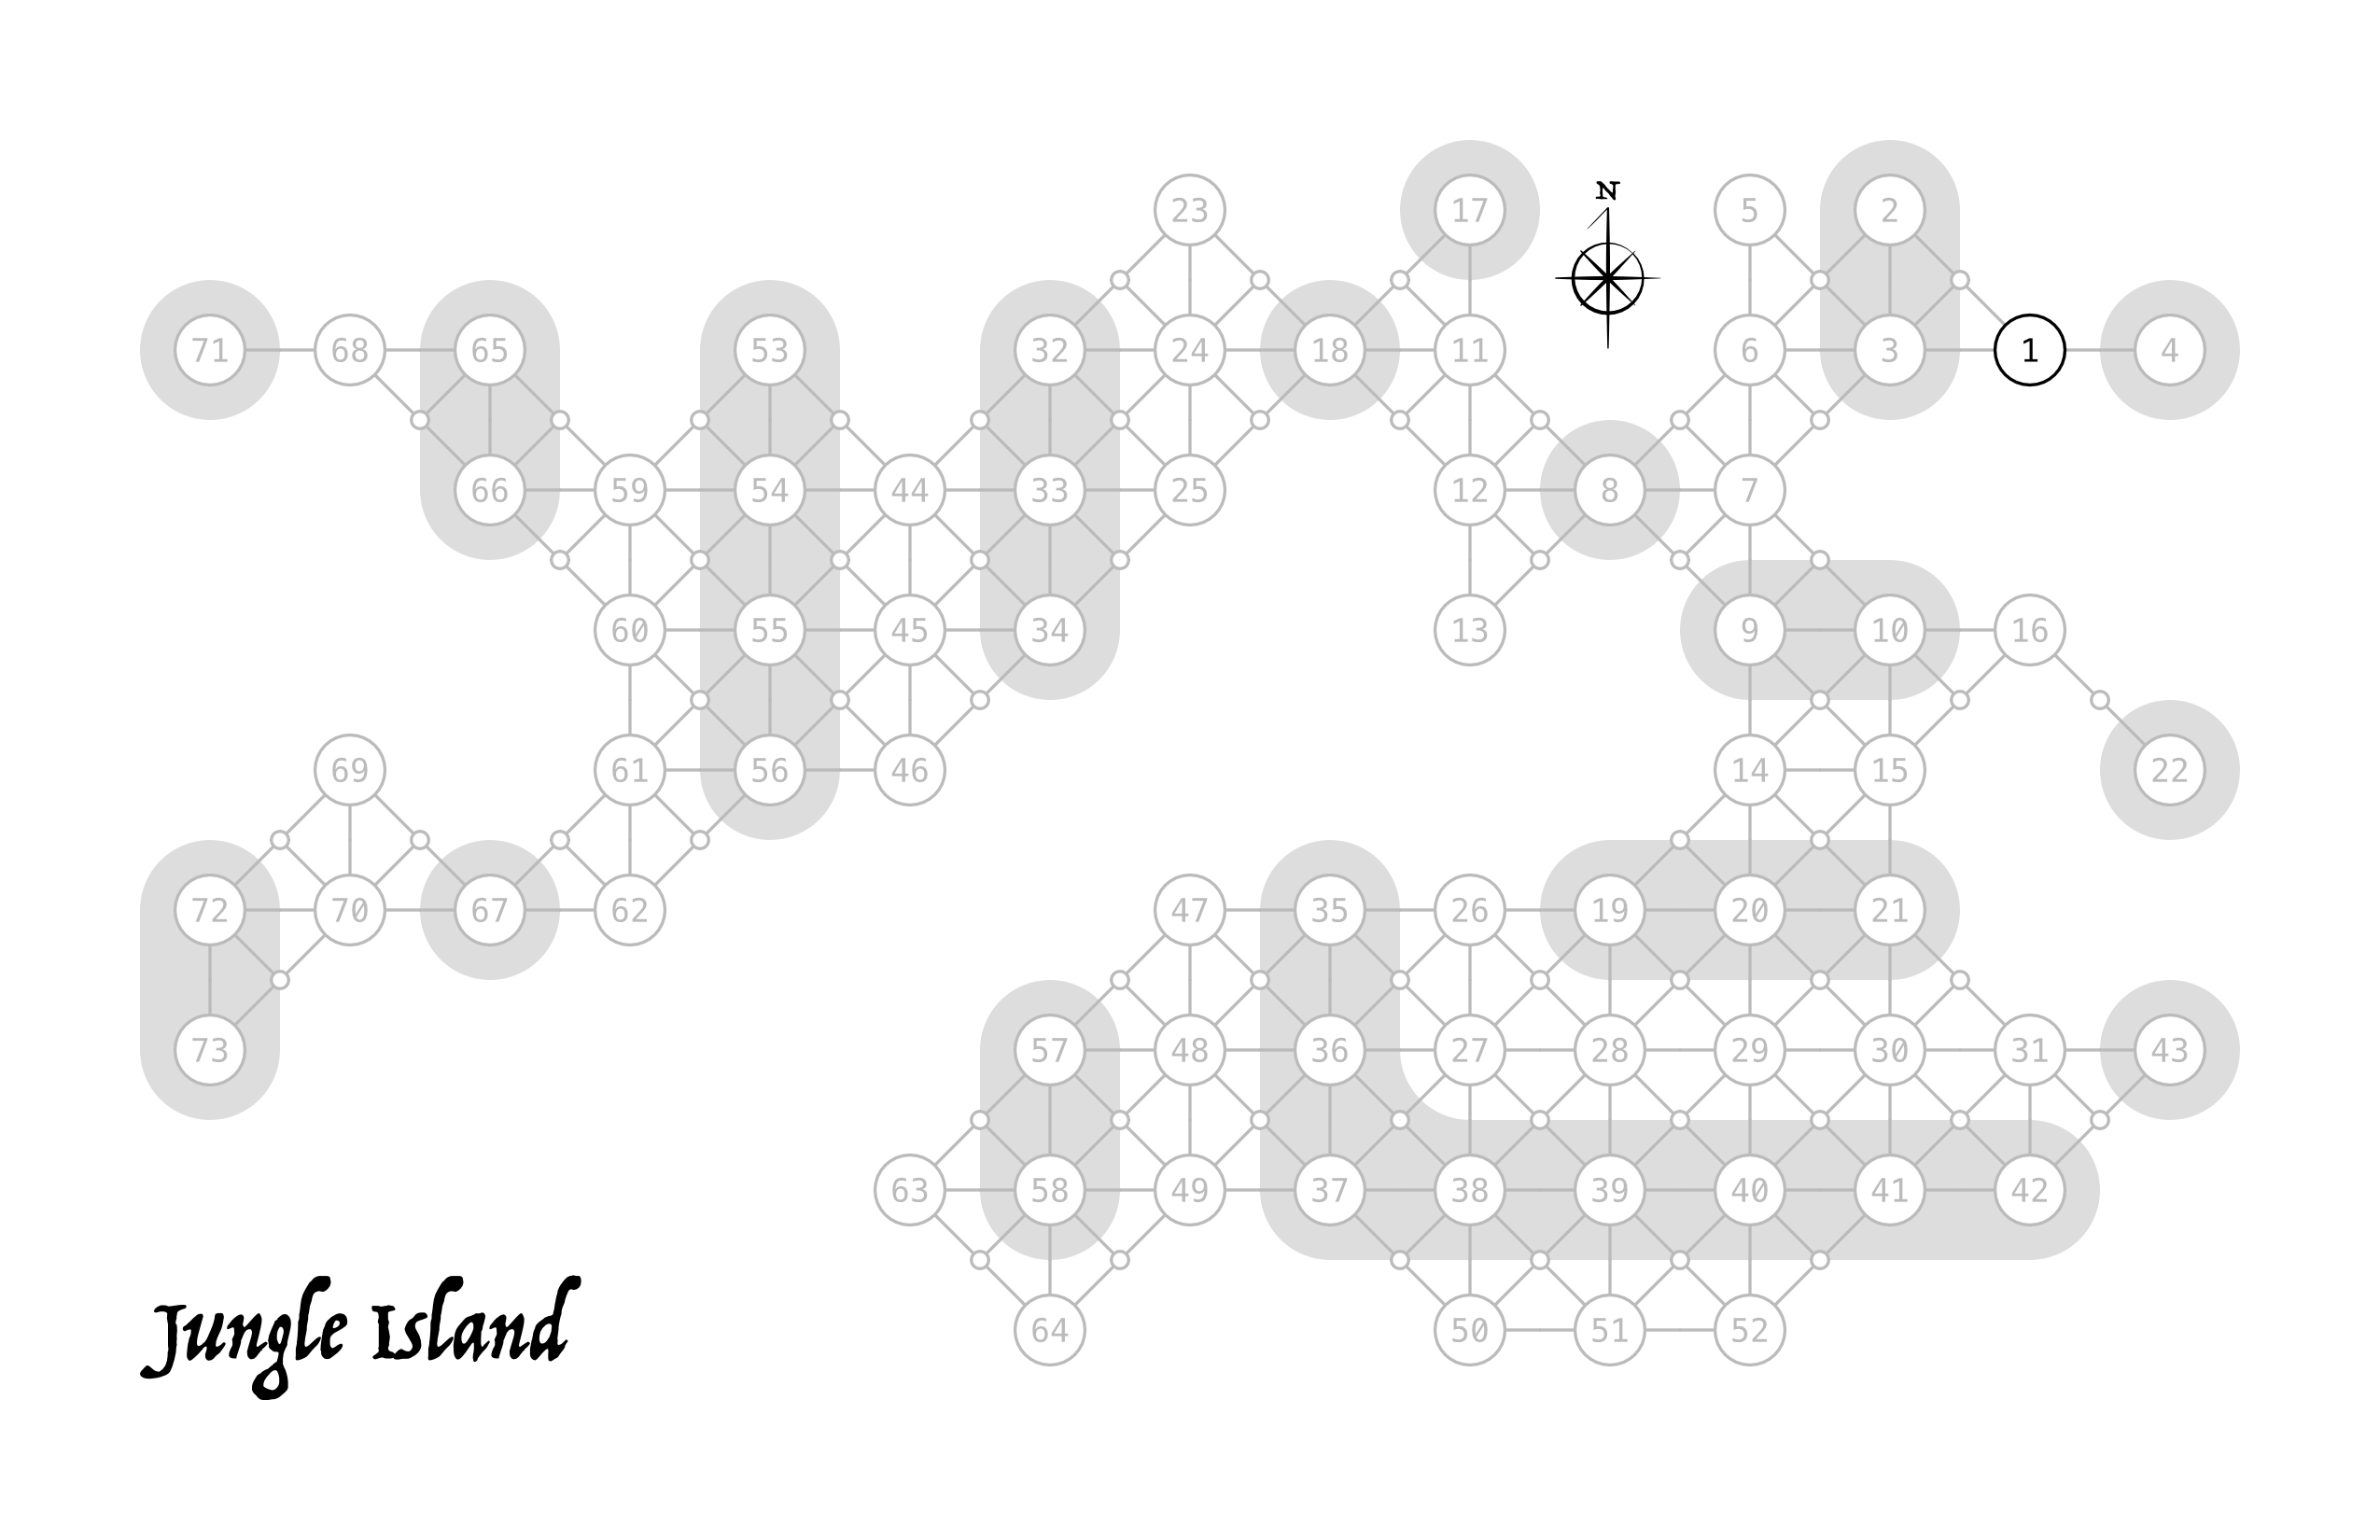
The party will still start at point 1 (in black) and the gray shapes are still how to quickly count depth in the number of points you need to travel to get to any point from point 1. There are 73 points total on this map, which is a reduction, but I honestly had 99 the first time arbitrarily. There are still 13 depths (0 to 12) but now the number of points per depth are 3, 3, 3, 6, 6, 9, 12, 9, 6, 6, 3, 3, and 3 respectively.
This table has a pleasantly balanced shape to it and I still feel like overall the balance of predictability and variability is preserved. I can still guess pretty roughly how many of each result will appear but where on the island still unpredictable. This balanced shape really makes categorizing the frequency easy; Common (8 results), Uncommon (8 results), and Rare (8 results).
The way I’m thinking about how to slot the modules into this table also works well with these frequency categorizations; 50% will come from the core setting and 25% each will come from two modules for all three frequency groups. However Mod 1 will appear slightly less frequently in the front half of the island, but make it up in the back half.
| Result | Early (E) | Mid (M) | Late (L) | Total | Phase | Frequency | Source |
|---|---|---|---|---|---|---|---|
| 1 | 25% | 0% | 0% | 25% | E | Rare | Core |
| 2 | 50% | 0% | 0% | 50% | E | Rare | Mod 1 |
| 3 | 75% | 0% | 0% | 75% | E | Rare | Mod 2 |
| 4 | 1/25% | 0% | 0% | 1/25% | E | Rare | Core |
| 5 | 1/25% | 50% | 0% | 1/75% | E M | Uncommon | Core |
| 6 | 1/25% | 1/25% | 0% | 2/50% | E M | Uncommon | Mod 1 |
| 7 | 1/25% | 2/25% | 0% | 3/50% | E M | Uncommon | Mod 2 |
| 8 | 1/25% | 3/0% | 0% | 4/25% | E M | Uncommon | Core |
| 9 | 1/25% | 3/50% | 0% | 4/75% | E M | Common | Core |
| 10 | 1/25% | 3/50% | 50% | 5/25% | E M L | Common | Mod 1 |
| 11 | 1/25% | 3/50% | 75% | 5/50% | E M L | Common | Mod 2 |
| 12 | 1/25% | 3/50% | 1/0% | 5/75% | E M L | Common | Core |
| 13 | 1/0% | 3/50% | 1/25% | 5/75% | E M L | Common | Core |
| 14 | 75% | 3/50% | 1/25% | 5/50% | E M L | Common | Mod 1 |
| 15 | 50% | 3/50% | 1/25% | 5/25% | E M L | Common | Mod 2 |
| 16 | 0% | 3/50% | 1/25% | 4/75% | M L | Common | Core |
| 17 | 0% | 3/0% | 1/25% | 4/25% | M L | Uncommon | Core |
| 18 | 0% | 2/25% | 1/25% | 3/50% | M L | Uncommon | Mod 1 |
| 19 | 0% | 1/25% | 1/25% | 2/50% | M L | Uncommon | Mod 2 |
| 20 | 0% | 50% | 1/25% | 1/75% | M L | Uncommon | Core |
| 21 | 0% | 0% | 1/25% | 1/25% | L | Rare | Core |
| 22 | 0% | 0% | 75% | 75% | L | Rare | Mod 1 |
| 23 | 0% | 0% | 50% | 50% | L | Rare | Mod 2 |
| 24 | 0% | 0% | 25% | 25% | L | Rare | Core |
The good news is I can definitely make a map that’s not just rectangular. I’m not sure this is the map though. This one feels like kind of a mess. There are multiple choke points and that doesn’t make for a good game map. If I offered this it would have to be as a suite of potential maps. Which I kind of like the idea of, but we shall see.