Welcome to Bloodwood Isle
I’ve come up with a name for the project. Bloodwood Isle was the name for an idea I originally had for a different adventure, but this project is so large I don’t see other adventure writing being frequent in my future. If I cycle back to the original idea I’ll choose a new name.
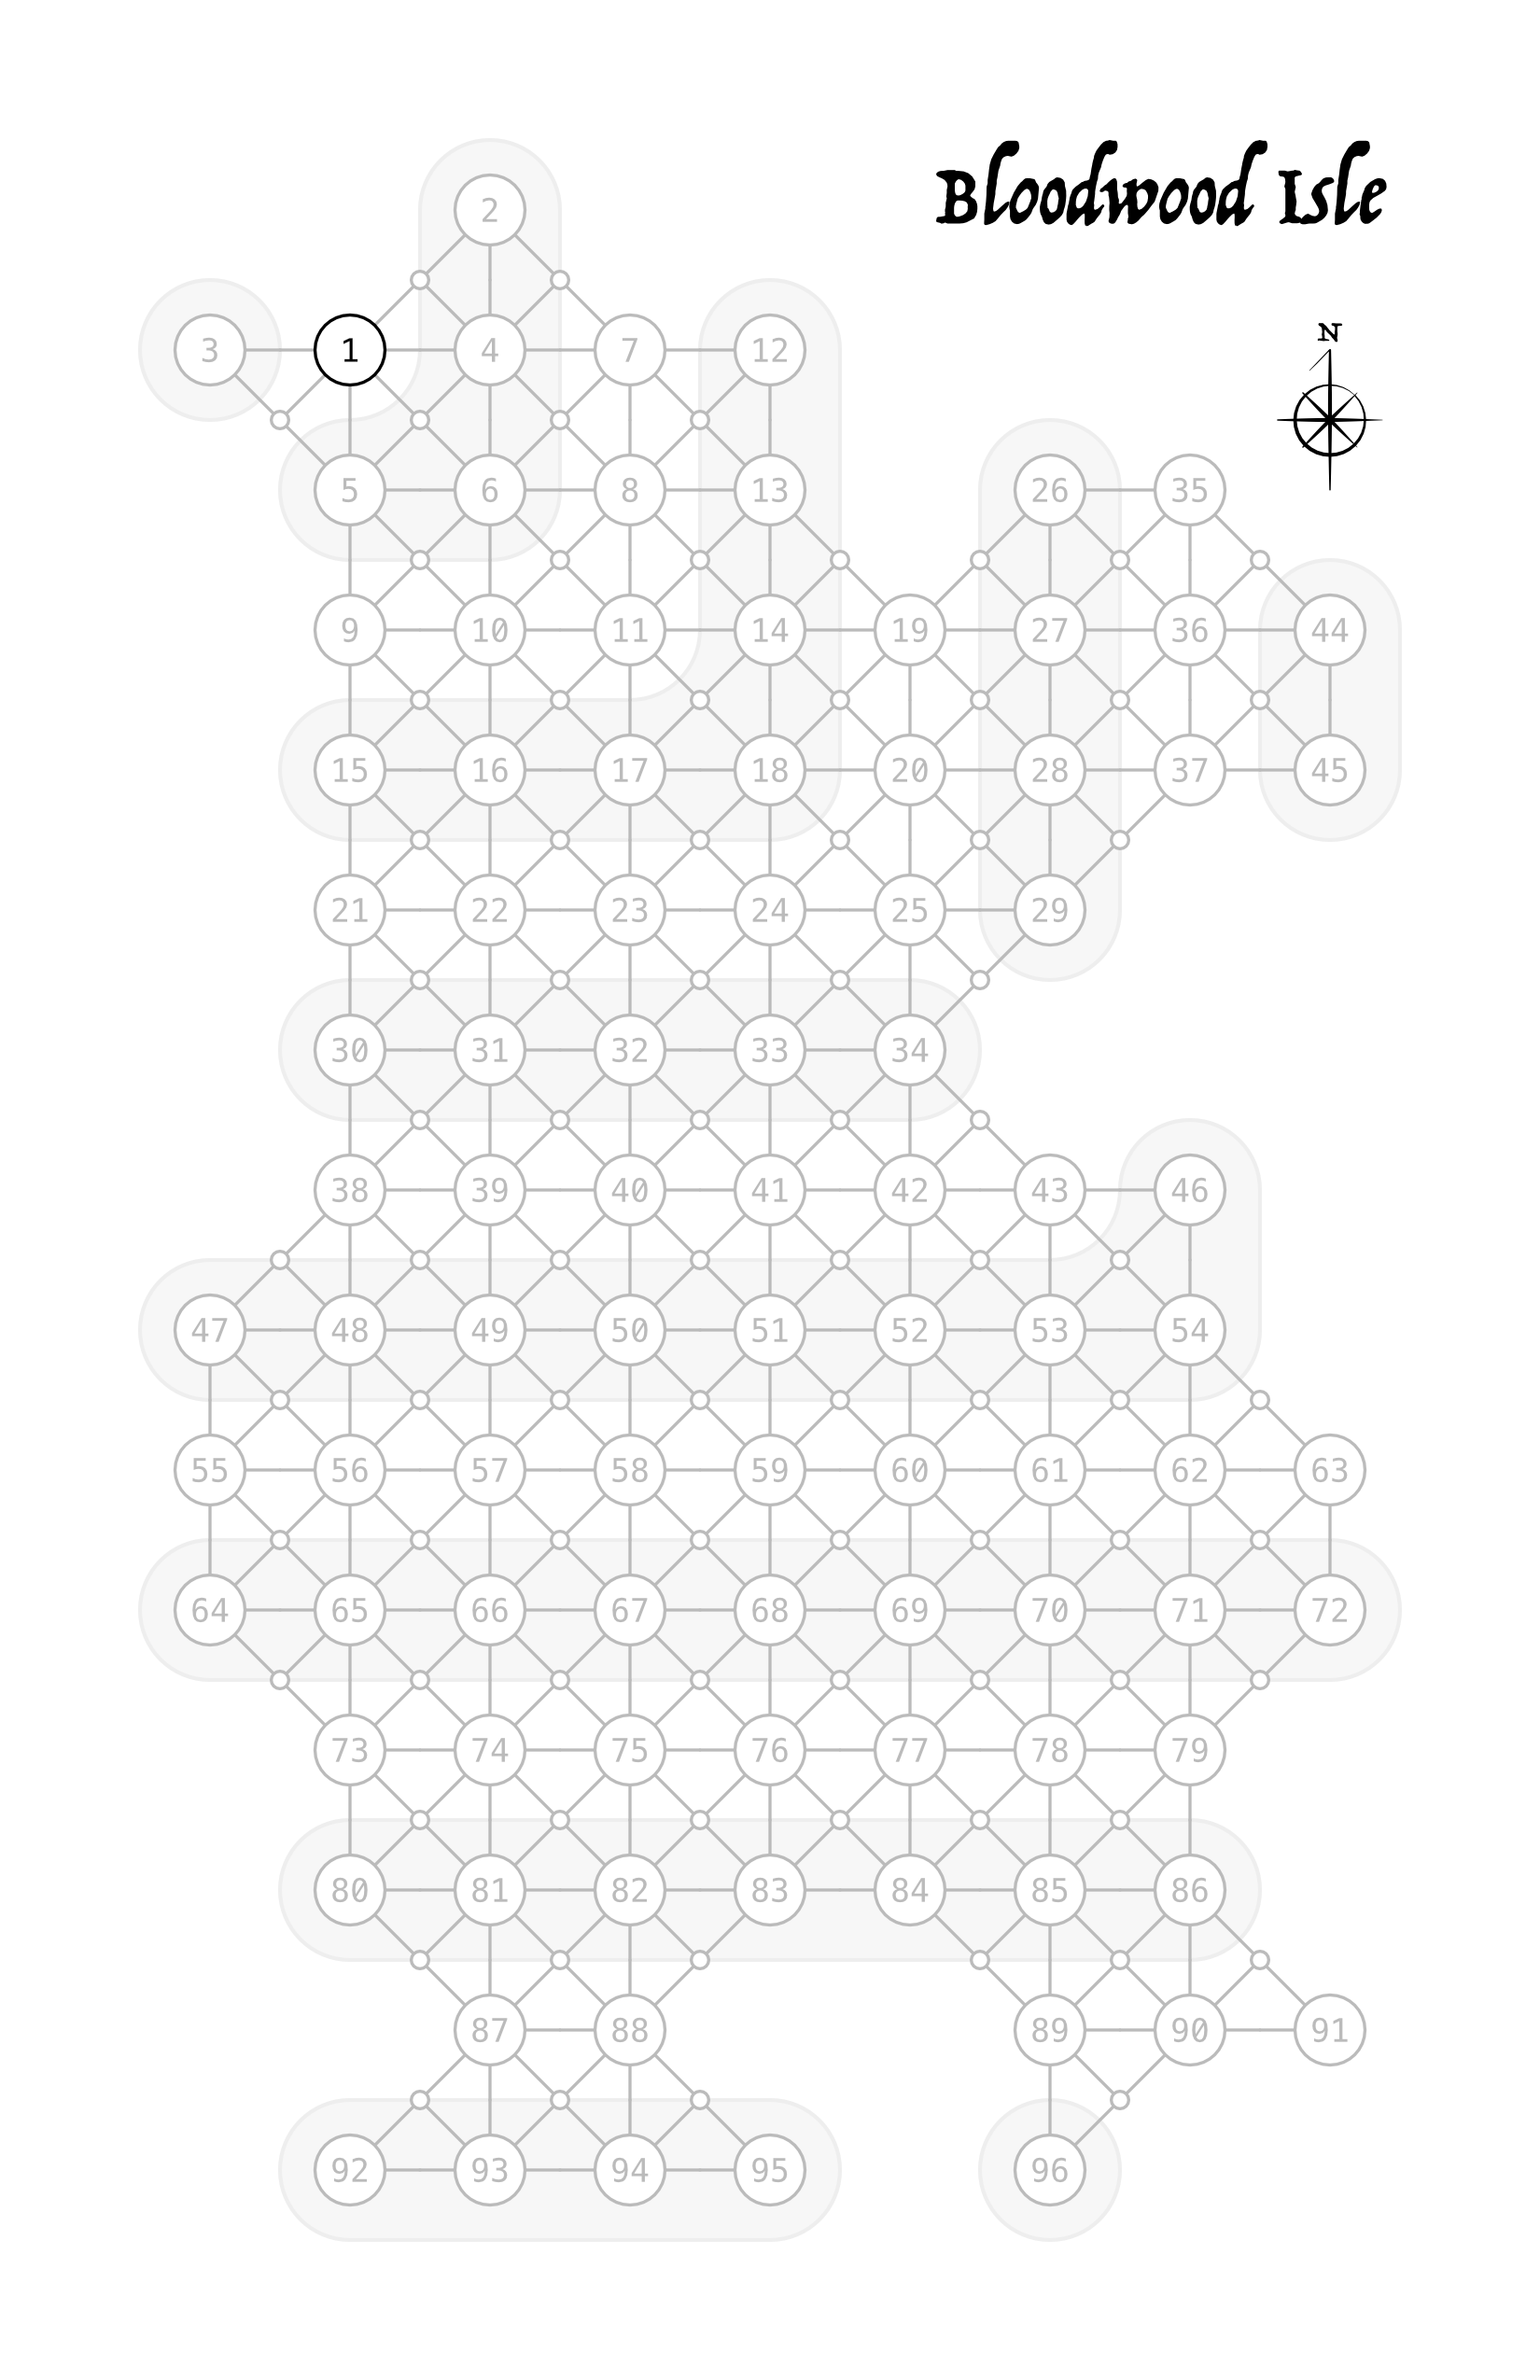
Taking what I’ve learned about the math of depthcrawls, searching for a probability shape I find acceptable, and turning that shape into a map that I like the look of got me to what I’m posting today. There are 96 points total on this map and the 13 depths (0 to 12) have points in the distribution 5, 5, 7, 7, 9, 9, 11, 9, 9, 7, 7, 5, and 5 respectively. Beyond finding a distribution and layout for the points I like. I also decided to rotate the orientation of the island to portrait. I have delusions that I’ll make PDFs of this project available and this orientation will fit much better in a digest sized book layout.
Bloodwood Isle Map
Looking at the Probability
The shape I’ve chosen is a bit of a gentile V, so the Frequency bands are pretty subjective. Mostly it’s meant as a guide for me when writing Locations and Details. This shape will give me approximately 9 “rare”, 32 “uncommon”, and 54 “common” points for each instance of the island. Because the Locations and Details are rolled separately it’s possible to end up with a “common” location paired with a “rare” detail creating lots of unpredictability. Add Events and Encounters to the mix I’ll get a ton of variability from instance to instance of the island.
Bloodwood Isle Probability Distribution
Results are simulated via ruby script1 and rounded so some of the rows don’t add up exactly in the Total column.
| Result | Early (E) | Mid (M) | Late (L) | Total | Phase | Frequency | Source |
|---|---|---|---|---|---|---|---|
| 1 | 42% | 0% | 0% | 42% | E | Rare | Core |
| 2 | 83% | 0% | 0% | 84% | E | Rare | Mod 1 |
| 3 | 1/42% | 0% | 0% | 1/42% | E | Rare | Mod 2 |
| 4 | 2/0% | 0% | 0% | 2/0% | E | Rare | Core |
| 5 | 2/0% | 75% | 0% | 2/75% | E M | Uncommon | Core |
| 6 | 2/0% | 1/50% | 0% | 3/50% | E M | Uncommon | Mod 1 |
| 7 | 2/0% | 2/41% | 0% | 4/42% | E M | Uncommon | Mod 2 |
| 8 | 2/0% | 3/17% | 0% | 5/16% | E M | Uncommon | Core |
| 9 | 2/0% | 3/92% | 0% | 5/92% | E M | Common | Core |
| 10 | 2/0% | 3/92% | 58% | 6/50% | E M L | Common | Mod 1 |
| 11 | 2/0% | 3/92% | 1/17% | 7/9% | E M L | Common | Mod 2 |
| 12 | 2/0% | 3/92% | 1/59% | 7/50% | E M L | Common | Core |
| 13 | 1/58% | 3/92% | 2/0% | 7/50% | E M L | Common | Core |
| 14 | 1/17% | 3/91% | 2/0% | 7/8% | E M L | Common | Mod 1 |
| 15 | 58% | 3/92% | 2/0% | 6/50% | E M L | Common | Mod 2 |
| 16 | 0% | 3/92% | 2/0% | 5/92% | M L | Common | Core |
| 17 | 0% | 3/16% | 2/0% | 5/17% | M L | Uncommon | Core |
| 18 | 0% | 2/42% | 2/0% | 4/41% | M L | Uncommon | Mod 1 |
| 19 | 0% | 1/50% | 2/0% | 3/50% | M L | Uncommon | Mod 2 |
| 20 | 0% | 75% | 2/0% | 2/75% | M L | Uncommon | Core |
| 21 | 0% | 0% | 2/0% | 2/0% | L | Rare | Core |
| 22 | 0% | 0% | 1/42% | 1/42% | L | Rare | Mod 1 |
| 23 | 0% | 0% | 83% | 83% | L | Rare | Mod 2 |
| 24 | 0% | 0% | 42% | 42% | L | Rare | Core |